
April 18, 2024
24 mins read
24 mins read


Each month we will ask a Product Specialist at Exactal what their favourite feature of CostX is, and how it can be used. This month, we are speaking to our Brisbane-based Product Specialist Gavin Termine.
Hi there to all the CostX Fans out there!
If you’re reading these CostX blogs, I guess you’re probably a CostX fan like myself. Within this blog, I’m sharing my favourite feature about CostX.
Probably the feature at the top of my list is the 3D BIM Model Maps. It is undoubtedly one of the most powerful features amongst CostX’s huge range of powerful tools.
Now, to get this blog in the direction of using Model Maps, I’ll begin by saying that one of the most daunting prospects of dealing with modern large-scale 3D BIM models these days is the massive amount of data that is attributed to every single object within that model. Then there are the innumerable and diverse descriptions, categories and family groups created by the various 3D modelling software programs out there.
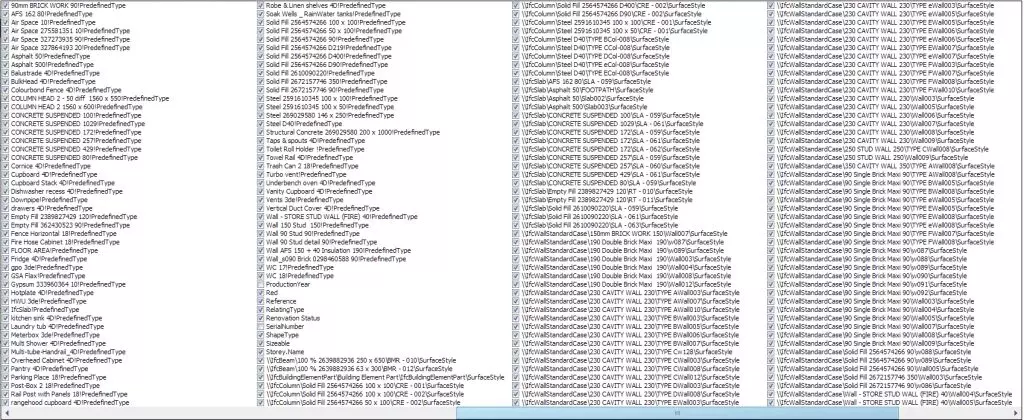
When you first open one of these 3D models and start examining its BIM data schedule, you are presented with information thousands of columns wide and rows deep in data.
For example, check out this schedule snippet below, taken from a relatively small model (80MB). It’s overwhelming, but when shown in the CostX schedule handler, you can at least turn unwanted data off via the check boxes, or right-click to unselect all, and then just turn on the stuff you need. Simple in theory!?
Okay, you can be forgiven for thinking, “How the heck am I going to sort all this data out and find the data I need”??
This is just a simple example as well- 3D models can get massive – over 100MBs in size! And if you’re not using a 64bit system with (of course) a 64bit version of CostX, you’re not going to be able to even open these models. An awesome Rig would go a long way to making life easy for those serious about BIM! A very condensed 100MB model once fully generated, can sometimes use over 10GB of RAM. Then, once all the revisions start coming through, and the CostX auto-revisions of the updated models start being applied, well, all this adds up to more and more data…
So, how do I deal with all this afore mentioned data? I use CostX’s ‘holy grail’ – Model Maps!
With this tool, a CostX user can not only decide what they want, but how they are going to measure it, what folders they would like to create to categorise their measures, what data or combination of data they would like to use to produce their measures … and the list goes on!
This is why CostX Model Maps are still one of my favourite and rewarding tools to use. No matter how complex the Architects and Consultants get with their models, I know I have the technology under my fingertips to rein in their information and convert it into the data I need to quantify and price every aspect of the project.
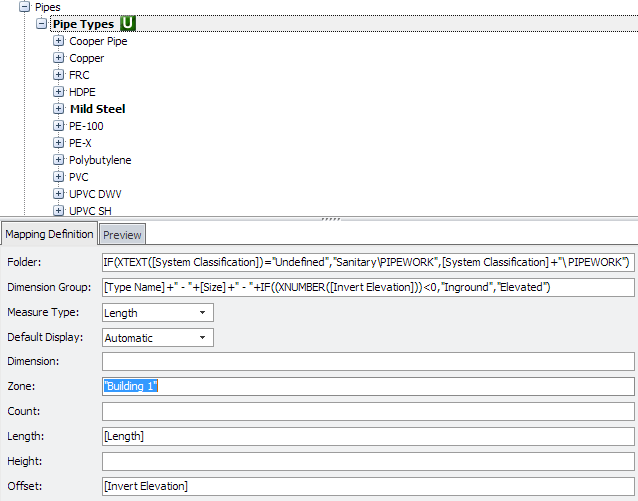
For example, I’ve added an image below of some MEP objects which have been categorised in the model tree as per their basic materials. The client obviously wants the MEP priced up into their relevant services. Within this example’s Mapping Definitions, firstly in the ‘Folder:’ field, I’ve added an “IF” function in the formula to place any undefined pipes into the Sanitary section. In the ‘Dimension Group:’ field, I’ve separated the elevated piping from the in-ground piping using an “IF” function to segregate them by their invert levels. In this case, simply by sorting anything with an invert level less than zero, it will be considered in the ground.
The subsequent extraction gives me these results in the image below:
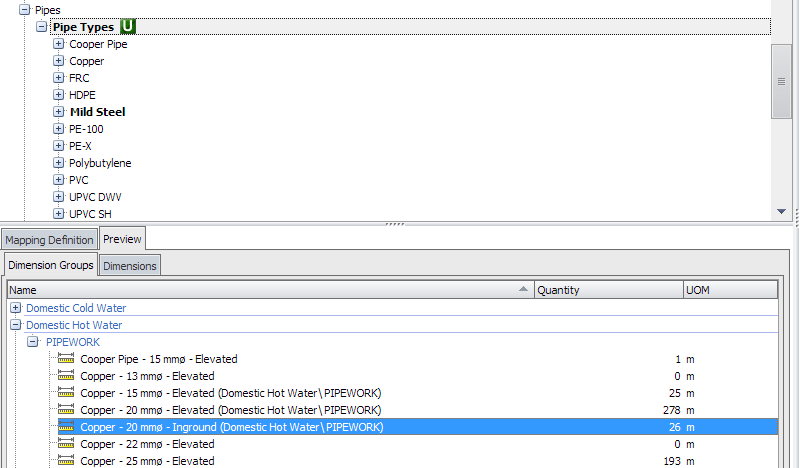
By the way, I’m just using the preview button to test my formula above. This way, if there are still unwanted results showing up, I can go back and make some adjustments.
You may notice how the Mild Steel folder is also in a bold font like the Pipe Types folder.
The reason for this is that while creating the examples, I found that the System Classification wasn’t a service description the client required. Instead of adding more “IF” statements in the Folder field formula of the Pipe Types, I just created an overriding Model Map definition to the Mild Steel group separately. See image below:
I could go on with many other examples here, but for now, I hope I have been able to give a glimpse of the possibilities when using CostX Model Maps, and why I consider it one of my favourite features.

E-BOOK